View your data in real-time from any browser
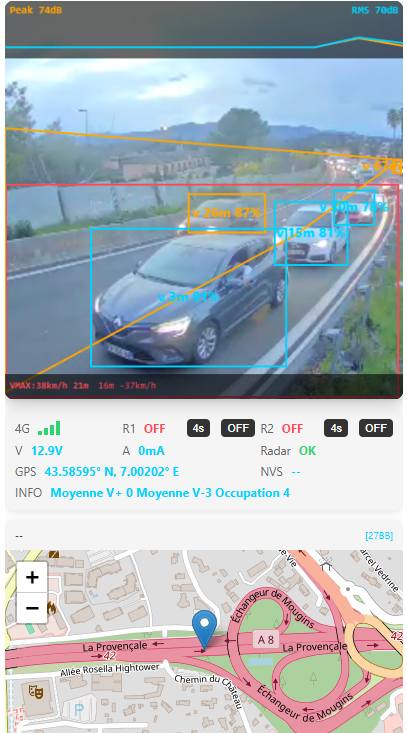
Image Legend:
Blue: Counted vehicles
Yellow: Detected but excluded vehicles (polygon exclusion zone for single lane counting)
Red: Capture zone (measurement trigger)
24/7 Data - PC, tablet or smartphone
Video viewing limited to 30 sec (control and adjustment)
Access Portal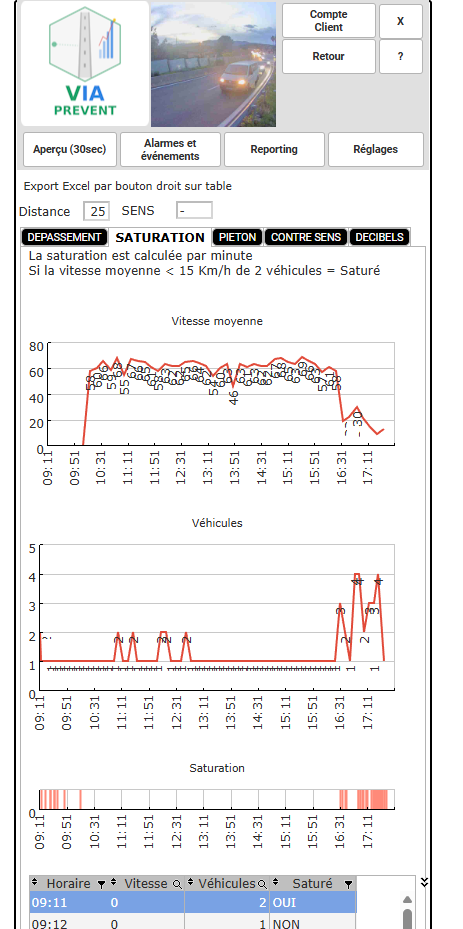
Saturation analysis: average speed, vehicle count, real-time congestion detection


No Civil Engineering
Quick and discreet installation on a simple roadside pole, at 2.5 or 3 meters height. Autonomous thanks to 100W solar panel + battery (minimum 9 days autonomy).